

What you’ll get from this article
- Know the two required inputs. You need both the contract and the shipment data to perform the complete rate analysis.
- Separate analysis from optimization. Rate analysis shows how the agreement prices your freight; optimization decides which levers to change.
- List the data you need. Rate sheets, minimums, fuel, accessorials, and the shipment fields that make the math real.
- See how discounts and minimums interact. Why a strong discount can still produce a weak invoice on small or dense-skewed freight.
- Target the levers that move landed cost. DIM divisor, minimums, and accessorial caps or bundles—then simulate before you negotiate.
- Separate profile fit from market benchmarks. What you can answer with your data—and what you cannot without comparable market rates.
Try the Interactive Tool: Use the free, anonymous Carrier Contract Optimization Simulator to model how a DIM divisor change affects billable weight and estimated savings before you renegotiate.
When people search for how to evaluate freight contracts using data or carrier contract rate analysis, they want a method: how will this agreement price my freight. Rate analysis is that method—contract rules applied to shipment history. Optimization is the next decision—which levers (dimensional weight rules, minimums, accessorial caps) move landed cost enough to negotiate. This article covers both. You need both the contract and the shipment data to perform the complete rate analysis.
Introduction
The rate table is one input. Discounts, billed-weight rules, minimums, fuel, and accessorials are the rest. Rate analysis is the work of putting those pieces together against real shipments so expected cost becomes visible before you sign—or before you renegotiate. Carrier contract optimization starts after that model is honest: you pick the clauses that actually drive your invoice, not the headline discount on the sales deck.
This page educates on that method. It is not a substitute for legal review, and it does not claim to tell you whether your rates beat the open market without benchmark data. It shows what belongs in a complete analysis, what data to gather, which levers to prioritize, and how to use them.
What carrier contract rate analysis actually means
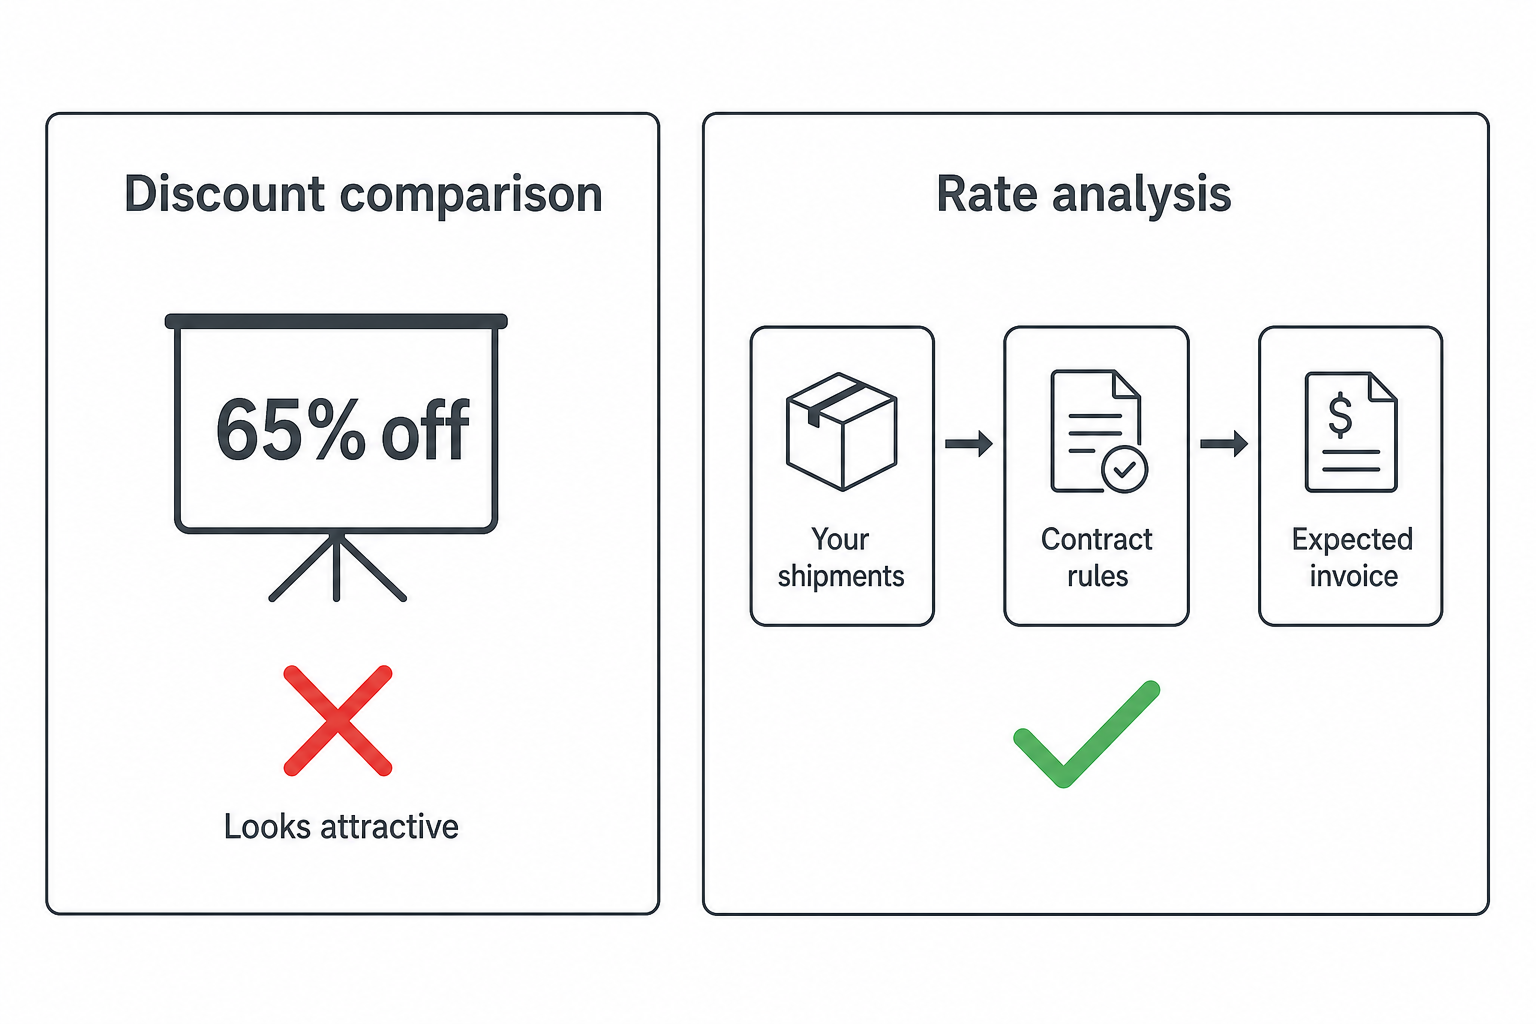
Carrier contract rate analysis is a structured way to answer: how will this agreement price my freight?
In practice, that means taking the contract’s pricing rules—rates or discounts, dimensional and billed-weight logic, minimums, fuel, accessorial triggers—and applying them to a representative set of your shipments. The output is expected landed cost by shipment, lane, and period. From there you can compare proposals, spot weak clauses, and prepare negotiation asks.
What a complete analysis needs
You need both the contract and the shipment data to perform the complete rate analysis.
- Contract side. Rates/discounts, DIM and billed-weight rules, minimums, fuel, accessorial menu
- Shipment side. History rows with weight, cube, lanes, service, and accessorial flags
- Work. Rebuild each shipment → roll up by lane and month → compare or negotiate
Two different questions people mean by “are my rates good?”
Search intent often mixes two separate questions. Keep them apart.
What you can answer—and what you cannot—with contract + history
Fit for my shipping profile?
Can be answered with your data
- Contract rate tables and rules
- Accessorial and fuel mechanics
- Your shipment / invoice history
- Contract A vs Contract B on the same extract
This article’s focus
Competitive vs the market?
Needs more than your contract PDF
- Market or peer benchmarks
- Comparable shipper data
- Carrier bid / lane reference rates
- Normalization for volume, mode, geography, mix
Outside a PDF-only review
You can judge whether a contract suits your mix, or which of two proposals bills better on your history, without market benchmarks. You cannot responsibly claim “market competitive” without them.
Why the contract alone is incomplete
The same agreement can be workable for one shipper and expensive for another. Your mix decides which rules dominate the bill.
- Density / cube — light bulky freight feels dimensional rules; dense freight often bills on actual weight
- Shipment size — small releases hit minimums more often
- Delivery pattern — residential, liftgate, and appointment share drive accessorial spend
- Dock reality — curb and job-site stops do not price like dock-to-dock
- Lane mix — thin or awkward lanes expose coverage and exception pricing
Reading the contract without shipment data is like reading a menu without knowing what you order. The prices may be clear. The bill still depends on consumption. See the Carrier Contract Review and Rate Analysis hub for the broader path.
What data is needed
You do not need a perfect data warehouse. You need enough structure that rates can be applied to real shipments—and that two proposals can be run against the same facts.
Two inputs for every complete analysis
Contract documents
What the carrier prices
- Rate / discount schedules
- Billed weight & DIM rules
- Minimum charge schedule
- Fuel index / table
- Accessorial price list + triggers
- Account exceptions / waivers
Shipment fields
What you actually ship
- Origin / destination (as rated)
- Service / mode
- Weight, dimensions, pieces
- Class / density (if LTL)
- Accessorial flags at tender
- Ship date + shipment key
Use 60–90 days of representative volume. Consultants, auditors, and tools that offer “contract analysis” still need this shipment side—whether they ask for it up front or pull it from invoices later.
How discounts, minimums, fuel, and accessorials interact
Think in invoice layers—not a single discount cell.
Contract cost per shipment
Landed cost ≈ Linehaul + Fuel + Accessorials + Min / adjustments
Linehaul depends on billable weight (often max of actual vs dimensional) and the lane/service rate or discount. The discount matters—it is one input, not the whole analysis.
Apply rates to each shipment in history:
- Billable weight — apply DIM and rounding rules
- Base charge — rate × billable weight (or your tariff/discount method)
- Minimum — raise to the floor if needed
- Fuel — use that week’s index or table
- Accessorials — add what the shipment facts would trigger
- Roll up — totals by lane, customer, and month
That stack is the core of profile-fit rate analysis. The Carrier Contract Optimizer helps when dimensional divisors differ; a spreadsheet works for a first pass. A later one-page tool may support a basic review—this article is the method behind it.
How to compare two proposals (and prepare for negotiation)
Hold the shipment extract fixed. Change only the contract rules.
- Same history — identical rows for Proposal A and B
- Full stack — billed weight, minimums, fuel, and accessorials on both
- Lane rollup — totals and averages by lane family and month
- Exception review — flag gaps driven by one rule (DIM, min, residential, liftgate)
- Negotiation list — turn those exceptions into specific asks (waive, cap, bundle, or reprice)
Later: an Ontario→Illinois walkthrough where a lower linehaul loses once liftgate is priced. Pair dollars with the Carrier Contract Scorecard.
Why a discount percentage is not a complete analysis
Discounts are a real part of pricing. They are not a complete analysis by themselves. A deeper discount on a harsher rule set—or with accessorials left at published tariff—can still cost more on your mix. That gap between the cover letter and the rebuilt invoice is what rate analysis is meant to surface.
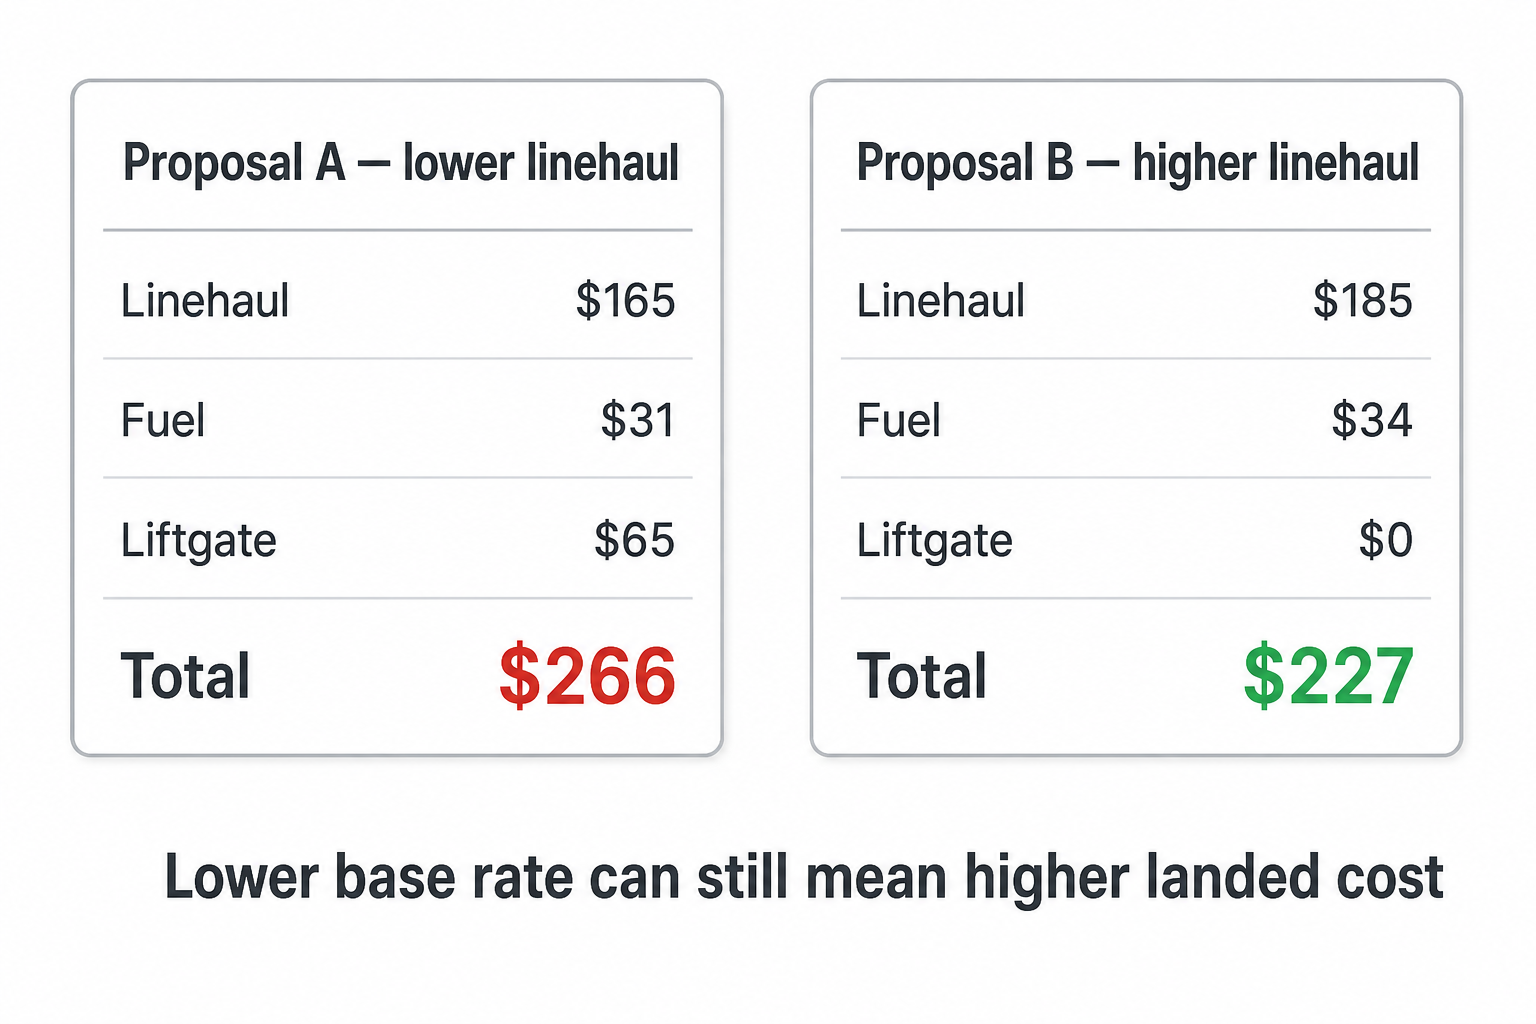
Same shipment, two proposals (illustrative)
Proposal A
Stronger-looking linehaul
Incomplete if you stop at linehaul
Proposal B
Higher linehaul, liftgate included
Lower landed cost on this mix
Numbers are illustrative. This shows profile-fit comparison—not a market benchmark claim.
When someone leads with only a discount percentage, ask:
- Discount off which tariff / base?
- How do billable weight and minimums behave on our mix?
- Are fuel and accessorials included in the modeled total?
- Was the claim proven against our shipment history—or a sales sample?
What a carrier contract really contains
If you flatten many agreements into categories, you will typically see a mix of commercial and operational terms that all influence total cost and risk.
| Section | Purpose and typical contents |
|---|---|
| Pricing structure | Defines how base money is computed: service scope and lane logic, base rates or pricing mechanisms, rules for billed weight, minimum charges, and definitions for when one rule overrides another. |
| Fuel and floating surcharges | Passes through or indexes costs that move with markets or schedules—often indexed, adjusted on a calendar, or tied to a published reference. Even when they look routine, they interact with the rest of the model. |
| Accessorials | Prices the extras beyond the assumed default move: appointments, residential or limited-access delivery, equipment at the dock, waiting time, storage, re-deliveries, special handling, and other event-driven charges. In practice these are not edge cases for every shipper—they are where process meets pricing. |
| Operational and legal risk | Allocates responsibility when something goes wrong: liability limits, claims windows and documentation requirements, declared value or similar constructs, and goods-specific restrictions. |
| Commercial terms | Governs how you and the carrier do business around the move: payment timing, invoicing conventions, dispute mechanics, confidentiality, and sometimes the right to audit or validate charges. |
| Duration and change mechanics | Sets how stable pricing is over time—not only about today. Often covers renewal, termination for convenience, notice periods, and whether rates can move mid-term under certain triggers. |
How the invoice lines up (conceptually)
Invoice ≈ Rate table + Rules + Dock & road
None of this replaces the rate table—it frames it. The lane row you negotiated is one term in the sum, not the whole bill.
Start with your own shipping profile first
Before you argue a line item, picture what you actually ship.
- A representative history slice (seasons + exception customers if that is your reality)
- Freight traits: density, packaging, stackability
- Pickup / delivery constraints and appointment needs
- Residential, job-site, or limited-access share
- Service must-haves vs. nice-to-haves
Many costly accessorials are not random—they show up when the promise or site does not match the default quoted move. Two shippers can read the same contract and get opposite outcomes. The agreement is judged against your mix.
The carrier evaluation quadrant matrix
Once you have a grounded shipping profile, the next mistake is treating carrier proposal evaluation as a single-number exercise—whoever shows the lowest average discount wins. Procurement teams that run disciplined multi-carrier bids use a weighted quadrant matrix instead. Each quadrant captures a distinct commercial dimension; together they strip relationship bias and sales narrative out of the selection.
Score each proposed agreement on a 1–5 scale within every quadrant, then multiply by the weight below. The weighted total is your carrier evaluation score—not a perfect oracle, but a structured way to compare proposals that look similar on the rate table.
| Quadrant | Weight | Commercial levers to score |
|---|---|---|
| Financial net variance | 35% | Simulated landed cost on 60–90 days of history; billed-weight and DIM divisor impact; minimum-charge frequency; fuel index behavior; accessorial incidence on real tenders—not headline linehaul alone. |
| Operational fit | 25% | Service scope vs. your lane mix; appointment and dock constraints; equipment assumptions (liftgate, inside, limited access); cutoffs aligned with production; recovery when service fails. |
| Administrative controls | 20% | Invoice predictability and audit rights; dispute windows; EDI/API or tender integration; re-weigh and reclass mechanics; clarity of accessorial triggers and documentation standards. |
| Risk and liability protection | 20% | Liability caps vs. product value concentration; claims filing windows; declared-value options; exclusions for your commodity class; packaging and inspection obligations you can actually meet. |
How to use the matrix in a bid
- Give every finalist the same shipment extract
- Score each quadrant before anyone sees competitor discounts
- Let financial net variance lead when service is comparable
- Use operational fit to catch dock/job-site mismatches
- Use admin + risk scores to catch invoice and claims traps
The matrix does not replace simulation—it forces simulation results, service evidence, billing legibility, and risk into one frame.
Review the service and lane structure
Coverage is not a slogan; it is a pricing boundary.
Confirm that the modes, lanes, and service types you rely on are explicitly in scope and priced the way your network operates. In many carrier agreements, the visible matrix is only part of the map. Exception geographies, alternate service areas, interline handoffs, or specialized segments may be handled differently—and sometimes not priced where you expect.
If your business has seasonal shifts, new customer concentration, or expansion lanes, ask what happens when volume moves outside the priced structure. A contract that is easy to administer in a steady state can become negotiation-by-exception in growth.
A practical test is simple: for each major lane family in your data, can you point to where it is priced, how exceptions are billed, and what default applies when the shipment does not fit cleanly?
Understand billed weight before comparing rates
You are not only comparing rates. You are comparing rules that convert physical freight into billable weight.
- Actual vs dimensional — many agreements bill the greater of the two
- Divisor, rounding, unit — these decide the invoice more than intuition does
- Package vs pallet vs shipment — measurement level changes outcomes
- Minimum billable units — small pieces can snap up to a floor
- Non-stackable / odd size — lost cube can price like heavier freight
- Re-weigh / re-measure — dispute rights and timelines affect predictability
For the cube math, see Dimensional weight explained.
Hypothetical scenario. A shipper picks Proposal A for lower linehaul. Finance later sees higher cost per shipment. The freight is light but bulky; dimensional rules dominate. The cheaper contract was built for a different density profile.
Minimum charges can distort the economics
Minimums are not mistakes. They are structural guardrails in many pricing systems. They matter most on short moves, small shipments, low-weight pallets, and lanes where the carrier’s fixed cost per stop shows up in commercial terms.
A minimum can override what the rate table says in a way that surprises people who only modeled the base math. This is especially true if your operational reality includes frequent small releases, split pickups, or multiple deliveries that each look inexpensive in isolation.
When reviewing an agreement, ask when minimums apply, whether they stack with other rules, and whether your shipment frequency turns occasional minimums into a pattern.
Accessorials are often where the contract gets expensive
Accessorials price daily exceptions: docks, appointments, residential stops, equipment, waiting, and re-work. Process design drives how often they appear.
- Appointment / notification
- Residential or limited-access delivery
- Liftgate / ground unload
- Inside delivery
- Waiting time, storage, re-delivery
- Special handling or temperature control when required
Map your top real exceptions to priced events, then estimate frequency. Clear menus beat vague “as required” language. Related reading: Freight accessorial charges explained · How to audit accessorials · Residential delivery fees.
Carrier contract negotiation for heavy freight
Carrier contract negotiation for heavy freight (machinery, overlength, flatbed) does not behave like retail pallet freight. Overlength triggers, detention sized for rigging, and tarping as a priced line usually move the invoice more than a few extra discount points. The dedicated walkthrough is how to negotiate a carrier contract for heavy freight — including mapping your last twenty heavy moves through the tariff before you sign.
Short version: do not treat a heavy-freight proposal like a standard LTL discount exercise. Map overlength caps, free time (often at least two hours when crane or tarping is involved), and securement fees as explicit lines. Then price your real mix, not a handful of easy lanes.
Hypothetical scenario. A shipper picks Proposal B for competitive core-lane rates. Many stops are residential remodel sites with tight windows. Appointment, re-delivery, and waiting fees stack outside the model. The rate table looked fine; the invoice did not.
Fuel and other floating surcharges
Fuel is easy to underweight in evaluation because it feels like a market passthrough. In a disciplined review, fuel should be treated as part of the total cost model, not as a footnote.
Understand the index or reference used, the timing of adjustments, and how fuel interacts with minimums and accessorials in practice. Some surcharge mechanisms move quickly; others lag. The point is not which is fair—it is whether your budgeting and customer pass-through mechanics can live with the behavior.
Some agreements also include other floating charges tied to capacity conditions or operational stresses. Even generalized language can matter if your lanes are volatile.
Liability, claims, and declared value
For many commodities, standard liability terms are a manageable backstop. For higher-value, sensitive, fragile, or regulated freight, the risk section can become commercially significant.
Claims procedures are not only legal text; they are practical requirements about notification timing, documentation, inspection, and packaging expectations. A typical provision may state a narrow window to file or impose documentation standards that busy warehouses struggle to meet consistently.
Where declared value or similar coverage exists, understand how it is purchased, what exclusions apply, and how it interacts with packaging and handling obligations. The question is not what is the theoretical limit, but what happens when our real damage pattern meets these rules.
This is especially relevant if your sales team quotes delivery promises that increase handling complexity. The contract’s risk terms and your customer commitments should make sense together.
Termination, renewal, and repricing risk
A strong operations leader thinks in horizons, not quarters. A carrier agreement may perform well today and still create fragility if pricing can shift unexpectedly or if exit is costly.
Review how renewals work, what notice is required, and whether either party can adjust rates under defined conditions. Even when terms are market-standard, the predictability of your landed cost matters for planning and customer contracts on your side.
If you are locked into capacity you need, that can be good. If you are locked into pricing that no longer matches your freight profile, that is a different problem. The evaluation framing is stability versus flexibility—there is no universal correct answer, but there should be an intentional choice.
What carrier contract optimization means in practice
Carrier contract optimization is not a synonym for “get a bigger discount.” It is the work of changing the terms that actually move your invoice once rate analysis has shown where spend concentrates.
Optimization in this sense is not a one-time bid event. It is the loop between your shipping profile, the rate sheets and tariff language in the agreement, and what actually invoices. When those three drift apart—new lanes, new packaging, new accessorial patterns—the contract can look fine on paper and still produce a higher landed cost than you modeled at signing.
Start by mapping where your spend concentrates: top lanes by volume and by dollar, accessorial codes that repeat, and minimum-charge lanes where small shipments cluster. Those three views tell you which contract clauses matter before you negotiate a headline discount. See the Carrier Contract Review hub for how rate analysis, billed weight, and accessorial terms connect to invoice behavior.
Three levers that usually move landed cost
Once the simulation shows where dollars leak, most shipper-side optimization work focuses on a short list of commercial levers—not a rewrite of the entire tariff.
- Dimensional / billed-weight rules. Divisor, rounding, and how cube becomes billable weight. A better divisor helps only when dimensional weight already beats actual weight on your mix.
- Minimum charges. Floor pricing on small or dense-skewed shipments. Negotiating the minimum (or the weight break where it applies) often beats chasing a deeper discount on lanes you barely ship.
- Accessorial caps, bundles, and waivers. Liftgate, residential, limited access, and similar fees that repeat on the same customer set. Bundling or capping high-frequency codes usually beats a generic “better rates” ask.
Fuel indexes and GRI mechanics matter too, but they are harder to “optimize” in a one-off negotiation than DIM, minimums, and accessorial schedules. Prioritize the levers your history proves you pay every month.
Optimization simulator
Model a DIM divisor change before you negotiate
Compare current vs target divisor on a representative package. See billable weight saved and estimated monthly/annual impact—anonymous, client-side only.
How to run a carrier contract simulation
Before executing a freight contract change, run a rigorous carrier contract simulation. Take your last 60–90 days of representative shipments—not only your cheapest lanes—and rebuild each move under the proposed rate sheets and tariff rules.
For each shipment record, apply the contract’s lane or zone pricing, discount structure, minimum charge, fuel index for the invoice week, dimensional or billed-weight rules, and the accessorial flags that should have applied at tender. Compare the simulated total to what you actually paid on the incumbent agreement. The gap is your carrier proposal evaluation: not whether row 47 looks better, but whether your network bills better.
A practical simulation stack looks like this:
- Shipment extract. Origin, destination, weight, dimensions, pieces, service level, and accessorials tendered.
- Rate sheet + tariff. Base rates, discounts, minimums, fuel table, accessorial price list, and DIM divisor or class rules.
- Rated output. Expected linehaul, fuel, accessorials, and total per shipment—then rolled up by lane and month.
- Variance review. Flag shipments where simulation diverges from historical invoice by more than a defined threshold; those are negotiation points or data-quality fixes.
Sample carrier contract simulation: Ontario to Illinois
The framework above is only useful when you run a concrete shipment through it. Below is a text-based carrier contract simulation walkthrough—a single PRO-level record you can replicate in a spreadsheet or rating tool.
Shipment profile. One pallet, 450 lb actual weight, dimensions 48″ × 40″ × 72″, class 70 equivalent, origin Mississauga ON (L5R), destination Naperville IL (60540), standard LTL, no hazmat. Tender notes: residential-style delivery with liftgate required; no inside delivery.
Incumbent agreement (Carrier A).
- Linehaul (rated at 520 lb billable after DIM): $184.50
- Fuel surcharge (18.5% on linehaul): $34.13
- Liftgate at delivery (contract rate): $0.00 — included in negotiated accessorial bundle for core lanes
- Residential / limited-access delivery: $7.87
- Simulated total (Carrier A): $226.50
Proposed agreement (Carrier B). Sales deck highlights a lower linehaul on the same lane.
- Linehaul (same 520 lb billable): $165.00
- Fuel surcharge (18.5% on linehaul): $30.53
- Liftgate at delivery: $65.00 — not in bundle; billed per published accessorial menu
- Residential / limited-access delivery: $5.77
- Simulated total (Carrier B): $266.30
What the math exposes. Carrier B’s base linehaul is $19.50 lower on this move—exactly the kind of row procurement teams paste into comparison slides. Net landed cost, however, is $39.80 higher because liftgate was never negotiated into the proposed accessorial schedule. At 200 similar deliveries per month, the $65 liftgate gap alone is $13,000 per month ($156,000 annualized if the pattern holds)—not visible until you simulate historical tenders, not until someone audits the first month of invoices.
This is discount masking: a cheaper rate table hiding worse total economics once real shipment attributes hit the tariff. Automated historical modeling—rebuilding each PRO under both agreements—is what converts carrier contract simulation from a talking point into evidence. Use the Carrier Contract Optimizer for DIM-divisor scenarios and the scorecard for operational dimensions; the simulation itself belongs on your shipment extract.
You do not need enterprise software to start. A spreadsheet with consistent PRO or shipment keys, VLOOKUP or INDEX/MATCH on lane tables, and a separate tab for fuel and accessorial rules is enough for a first pass. The Carrier Contract Scorecard helps pressure-test weak dimensions before you sign; pairing it with a simulation on real history is how carrier contract negotiation moves from opinion to evidence.
When you present findings internally or to the carrier, lead with lane-level landed cost and repeated accessorial triggers—not only the average discount tier. That framing supports best practices for negotiating carrier contracts: specific clauses, specific lanes, specific invoice lines—not a generic request for “better rates.”
A practical framework for comparing carrier contracts
A transportation pricing agreement is more than a grid of lanes: it is a forecast of how your tendered freight will move, bill, and behave under stress. When I move from comparing numbers to deciding whether to sign, I force the review across seven parallel checks—cost and billing mechanics, how the service matches the way we run, whether time and reliability support commitments, whether the carrier’s geography fits our real network, what happens when freight is damaged or lost, and whether the commercial terms will stay stable enough to plan against. I keep the snapshot below at hand when I compare proposals; what follows is the full reasoning behind each row.
Executive snapshot
The same seven checks as the framework below—compact enough to run in one sitting.
- Landed cost. Does modeled landed cost match our shipping mix and billing rules?
- Billing predictability. Can we forecast and audit charges from operational facts?
- Operational fit. Does handling, equipment, and appointment reality match our facilities and customers?
- Transit and reliability. Do transit times and service consistency support inventory and customer promises?
- Network coverage. Does coverage fit our origin–destination pattern, including thin or awkward lanes?
- Claims and risk. Do liability, exclusions, claims timing, and documentation match product value and our discipline?
- Pricing stability and commercial control. Are renewal, repricing, fuel, volume assumptions, amendments, and termination aligned with how long we need this arrangement to hold?
Seven-part framework for comparing carrier contracts: landed cost, billing predictability, operational fit, transit and reliability, network coverage, claims and risk, pricing stability and commercial control.
Headline rates are one input; operating, service, and commercial reality are the rest.
- Landed cost on actual shipping mix History · billed weight · minimums · accessorials · fuel
- Billing predictability Forecast · audit · fewer invoice surprises
- Operational fit Scope · packaging · appointments · equipment
- Transit time & service reliability Cutoffs · consistency · recovery
- Network coverage & lane fit O–D pattern · weak lanes · indirect points
- Claims & risk protection Liability · value · timelines · exclusions
- Pricing stability & commercial control Renewal · repricing · fuel · exit · amendments
Here is each check in plain language.
Landed cost on actual shipment mix
Model the agreement against real history—not a cherry-picked set of lanes. Build a landed-cost view that includes billed-weight logic and dimensional rules, minimum charges, representative accessorial rates, and how fuel or other floating charges behave on top. The point is to resist the conference-room habit of highlighting a few favorable rows. If the output still looks like a scrapbook of wins, you have not modeled the network; you have curated a story.
Billing predictability
Separate “cheap” from legible. Ask whether someone on your team can explain an invoice from shipment facts—origin and destination, freight characteristics, service level, accessorial flags—without a negotiation every month. Poor predictability rarely announces itself as fraud; it shows up as accrual misses, repeated adjustments, disputes, and finance burning time reconciling what operations thought had been tendered clearly. If you cannot forecast it, you cannot manage the customer promise attached to it.
Operational fit
Confirm that the service scope, handling assumptions, packaging realities, appointment environment, equipment needs, and exception paths match how your facilities and customers actually behave. A contract that assumes dock delivery will punish you when the business ships to construction sites with tight windows. A program built for stackable pallet freight is a poor match for a skew-heavy, non-standard mix. Fit is not soft; misfit is rework, rework is accessorials and delays, and both show up as dollars.
Transit time and service reliability
Price is only one dimension of fit. You need a clear picture of expected transit, how consistent delivery is in practice, how cutoffs and service calendars interact with your production and replenishment decisions, and how the carrier performs in the regions that matter to you—not only on averages but when the network is stressed. A cheaper agreement can still be the wrong decision if it drives stockouts, missed customer commitments, expedited freight to compensate, or chronic rework between sales and operations. Reliability is inventory, customer experience, and often hidden cost.
Carrier scorecard metrics and service level indicators
Carrier scorecard examples that actually change behavior define each metric operationally—what counts as a hit, what counts as a miss, and how the percentage is calculated—before you attach commercial consequences. Vague “good service” language is not auditable; shippers need baseline Service Level Indicators (SLIs) they can track monthly from TMS, carrier reports, or delivery confirmation data.
On-Time Delivery (OTD) — target ≥ 98.5%. Define on-time against the committed delivery date on the carrier’s service standard for that lane (not your customer’s aspirational date unless they are explicitly aligned). Count a shipment on-time if it arrives by 11:59 p.m. local on the committed date, or by the agreed appointment window when appointments are required. Calculation: (shipments delivered on or before commitment ÷ total shipments delivered in period) × 100. Exclude shipments where the shipper caused delay (late tender, incorrect address, refused delivery). Track OTD by lane family and region—aggregate averages hide chronic failure on thin lanes that matter to key customers.
Billing accuracy rate — target ≥ 99.0%. A clean invoice matches tendered facts: origin, destination, weight, class or billed weight, service level, and accessorial flags. Count an invoice as accurate if total charges are within an agreed tolerance (e.g., ±$5 or ±1%) of the expected rating from your contract rules, with no unexplained accessorial lines. Calculation: (invoices passing audit without adjustment ÷ total invoices received) × 100. Billing accuracy is how you track carrier contract reliability on the commercial side—OTD measures the road; billing accuracy measures whether the agreement converts to predictable dollars.
Tender acceptance rate — target ≥ 95.0%. For programs with electronic tender or contract acceptance workflows, measure how often the carrier accepts the load at the contracted service and rate without rejection, renegotiation, or silent downgrade. Calculation: (tenders accepted within SLA ÷ total tenders offered) × 100. Low tender acceptance forces expedites, backup carriers, and internal fire drills—cost that never appears on the incumbent’s rate table comparison.
Publish these three SLIs in your carrier scorecard review cadence (monthly for high-volume lanes, quarterly for stable networks). Tie them to corrective action before they tie to volume shifts: two consecutive months below threshold should trigger a root-cause review, not a passive spreadsheet update.
Automate the scorecard. You can score operational fit, billing predictability, and commercial control against the same dimensions in this article using the free Carrier Contract Scorecard—it walks through the seven evaluation lenses and surfaces weak clauses before renewal. Pair those qualitative scores with the SLI math above for a carrier scorecard that procurement, operations, and finance can share.
Network coverage and lane fit
Evaluate the carrier against your true origin–destination pattern, especially where the business is headed—not only the lanes that look good in a bid deck. Remote areas, indirect routings, seasonal lanes, and pockets where the carrier is thin on frequency or alternative service often determine whether the program works. Many agreements look strong on headline corridors yet weaken where your volume actually lives. If the contract is brilliant between major markets and thin everywhere else your customers are, you are pricing a fantasy network.
Claims and risk protection
Read liability limits, declared value or equivalent mechanisms, exclusions, claims notification windows, and documentation requirements alongside the value concentration and damage profile of your freight. Weak protection does not always show up as a lawsuit; it shows up when a run of losses wipes out the savings the tender celebrated. The terms need to match both product economics and your operational ability to meet notice, evidence, and packaging standards under real dock pressure.
Pricing stability and commercial control
Close with the time horizon. Understand renewal and termination mechanics, who can move price and under what triggers, how fuel or other pass-throughs are treated, what volume or mix assumptions the pricing rests on, how amendments are initiated, and what happens if the relationship needs to end or re-scope. The right question is not only whether the rate is attractive today, but whether the arrangement stays understandable and controllable across the period you are funding capacity, inventory, and customer commitments. An unstable commercial envelope turns even good base rates into a planning liability.
Collectively, these seven checks keep the conversation where it belongs: not which spreadsheet looks best in a room, but which carrier relationship will behave when your real freight, your real customers, and your real constraints hit the network week after week.
Self-assessment tool
Rate your carrier contract
Score the contract you're reviewing across all seven dimensions and get specific pushback points for weak areas.
Conclusion
A complete carrier contract rate analysis is an educational and operational method: gather the contract’s pricing rules, gather shipment history, apply the stack, compare when needed, and prepare negotiation from exceptions. Optimization is the next step—change the DIM, minimum, and accessorial levers your history proves you pay. Discounts matter. They are not the whole job.
- Contract rules + shipment data—both required
- Include minimums, fuel, and accessorials with linehaul
- Compare proposals on the same history extract
- Optimize the levers that move landed cost; treat market competitiveness as a separate, benchmark-dependent question
That is how you build a trustworthy analysis—and how you know what any consultant, auditor, or future review tool should ask for before claiming results.
You need both the contract and the shipment data to perform the complete rate analysis.
FAQ
What is carrier contract optimization?
Changing the terms that actually move your invoice once rate analysis has shown where spend concentrates—dimensional weight rules, minimum charges, and accessorial caps—not only a bigger headline discount.
How do you evaluate freight contracts using data?
Apply the contract’s pricing rules to representative shipment history. Include minimums, fuel, and accessorials. Compare proposals on the same extract. Negotiate from exceptions, not from a few sample lanes.
How do you track carrier contract reliability?
Pair transit reliability (on-time delivery) with billing accuracy—whether invoices match tendered facts and contract rating within a small tolerance—and watch repeating accessorial exceptions.
What is carrier contract rate analysis?
A method that answers how an agreement will price your freight by combining contract rules with shipment data. That is profile fit. Claiming rates beat the market needs separate benchmarks.